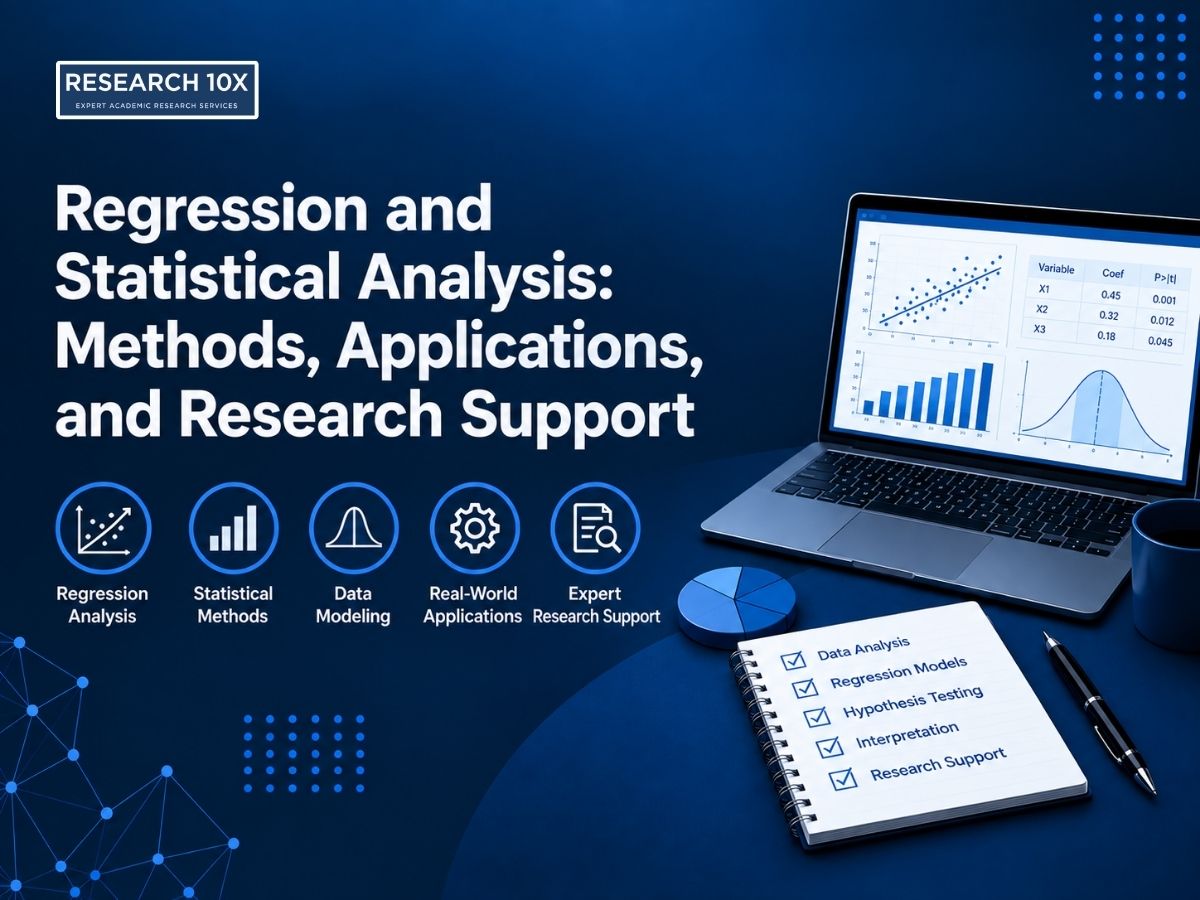
Regression and statistical analysis play an important role in quantitative research. They allow researchers to examine relationships between variables, test hypotheses, identify significant patterns, compare groups, and make evidence-based conclusions from collected data.
At Research10X, we provide Regression and Statistical Analysis Services for PhD scholars, Master’s students, academic researchers, university faculty, and professionals working on research projects. Our approach combines statistical expertise with research methodology so that the selected analysis is appropriate for the research question, dataset, and study design.
From data preparation and statistical testing to regression modelling, interpretation, and academic reporting, our team focuses on producing statistically sound and clearly explained research findings.
What Is Regression and Statistical Analysis?
Statistical analysis involves applying appropriate mathematical and statistical techniques to understand and interpret research data. Regression analysis is one of the most widely used methods for examining relationships between variables and determining how one or more predictors may influence an outcome.
However, selecting a statistical method should not be based solely on the software available. The research question, study design, variable types, measurement scales, sample characteristics, and statistical assumptions all need to be considered.
At Research10X, we first understand the research objectives and data structure before recommending an analytical approach. When researchers need broader guidance on research design and methodology, we also provide Research Methodology and Consulting Services.
Our Regression Analysis Expertise
Linear and Multiple Regression
We use linear and multiple regression techniques when researchers need to examine relationships between a continuous dependent variable and one or more independent variables.
Our analysis can include:
- Simple linear regression
- Multiple linear regression
- Regression coefficient interpretation
- Model summary interpretation
- R-squared and adjusted R-squared
- Significance testing
- Prediction and relationship analysis
Logistic Regression
When the dependent variable is categorical, logistic regression may be appropriate. We analyse the model based on the research objectives and relevant statistical assumptions.
We can assist with interpreting:
- Odds ratios
- Regression coefficients
- Model significance
- Predictor relationships
- Classification-related outputs
Panel Data Regression
For research involving observations across multiple entities and time periods, panel data regression may be considered.
Depending on the research design, our analysis can involve appropriate panel-data models and interpretation of relevant statistical outputs.
Time Series Regression
For studies involving observations collected over time, time series regression can be used to investigate trends, relationships, and time-dependent patterns.
We consider the characteristics of the time-series dataset before selecting and interpreting the appropriate model.
Regression Diagnostics and Validation
Regression results should be evaluated against relevant assumptions before conclusions are drawn.
At Research10X, we review important diagnostic considerations such as:
- Multicollinearity
- Heteroscedasticity
- Normality
- Outliers
- Model specification
- Independence of observations
- Residual behaviour
This allows us to identify potential issues that could affect the reliability or interpretation of a regression model.
Statistical Analysis and Hypothesis Testing
Regression is only one part of quantitative research. Depending on the research question and dataset, other statistical methods may be more appropriate.
Our statistical analysis expertise can include:
Descriptive Statistics
We use descriptive statistics to summarize datasets and provide an initial understanding of the collected data.
This may include:
- Frequencies
- Percentages
- Mean
- Median
- Standard deviation
- Minimum and maximum values
- Distribution summaries
Correlation Analysis
Correlation analysis allows researchers to examine the strength and direction of relationships between variables.
We consider the characteristics of the variables and research design when determining the appropriate correlation approach.
Hypothesis Testing
We provide statistical testing and interpretation for research hypotheses using appropriate techniques, which may include:
- t-tests
- ANOVA
- MANOVA
- Chi-square tests
- Non-parametric tests
- Other research-specific statistical tests
Reliability and Validity Testing
For questionnaire-based and measurement-focused research, we can assess reliability and support relevant validity analysis.
Depending on the research framework, this may include Cronbach’s Alpha and factor-based approaches.
Factor Analysis
When research involves multiple observed variables intended to measure underlying constructs, factor analysis may be appropriate.
Our expertise includes:
- Exploratory Factor Analysis (EFA)
- Confirmatory Factor Analysis (CFA)
- Factor loading interpretation
- Construct-related analysis
For projects involving structural equation modelling, researchers can also explore our SmartPLS SEM Consulting and Analysis Services.
How Do We Select the Right Statistical Method?
Choosing a statistical test starts with understanding the research question, not simply selecting a test from a statistical software menu.
At Research10X, we consider several factors before recommending an analytical method.
If You Need to Describe Your Dataset
Descriptive statistics can be used to summarize the characteristics of the collected data through frequencies, percentages, means, medians, standard deviations, and distributions.
If You Need to Examine Relationships
Correlation analysis can be used to evaluate the direction and strength of associations between variables.
If You Need to Compare Groups
Depending on the number of groups and research design, methods such as t-tests or ANOVA may be suitable for examining group differences.
If You Need to Predict an Outcome
Linear or multiple regression may be appropriate when the outcome variable is continuous, while logistic regression may be considered when the outcome is categorical.
If You Have Longitudinal or Time-Based Data
Panel data or time series techniques may be considered when observations are collected across entities or over different time periods.
If You Are Studying Latent Constructs
Factor analysis or structural equation modelling may be more appropriate when a study examines underlying constructs and relationships between them.
The final choice depends on the research objectives, study design, variables, sample characteristics, measurement scales, and statistical assumptions.
Why Statistical Assumptions Matter
A statistical model can produce an output even when the underlying assumptions have not been properly considered. This is why statistical analysis should involve more than simply entering data into software and generating tables.
At Research10X, we review relevant assumptions before interpreting statistical findings. For regression analysis, this may include checking multicollinearity, heteroscedasticity, normality, outliers, and other model-specific considerations.
We believe that statistical significance alone does not tell the complete story. Researchers also need to understand the size, direction, reliability, and practical meaning of their findings.
Our objective is therefore to provide analysis that is statistically appropriate and connected to the research objectives.
Interpreting and Reporting Statistical Results
Generating statistical output is only one stage of quantitative research. Researchers also need to understand what the numbers mean and present the findings appropriately.
At Research10X, our statistical reporting can include:
- Interpretation of statistical outputs
- Regression coefficient interpretation
- Significance and p-value interpretation
- Model-fit interpretation
- Results tables
- Charts and visualisations
- Explanation of significant and non-significant findings
- Academic presentation of results
- Chapter 4 results interpretation and review
- Publication-oriented statistical reporting
We focus on explaining findings in a way that connects statistical results with the research questions and hypotheses.
Statistical Software and Tools We Use
Our choice of software depends on the research methodology, dataset, statistical technique, and project requirements.
We work with a range of statistical, qualitative, and visualization tools, including:
Statistical Analysis Tools
- IBM SPSS
- AMOS
- SmartPLS
- R / RStudio
- Stata
- EViews
- Python
For researchers specifically working with questionnaire or quantitative datasets, our SPSS Data Analysis Services provide dedicated support for statistical analysis, hypothesis testing, interpretation, and reporting.
Qualitative Research Tools
Depending on the research methodology, we can also work with:
- NVivo
- ATLAS.ti
- MAXQDA
Visualization and Supporting Tools
Our wider analytical toolkit can include:
- Excel
- Power BI
- Tableau
- VOSviewer
The tool itself is not the primary consideration. We focus on selecting the approach that best fits the research methodology and analytical requirements.
Our Regression and Statistical Analysis Process
At Research10X, we follow a structured process to maintain consistency and methodological accuracy throughout the analysis.
Step 1: Understanding Your Research Objectives
We begin by reviewing your research questions, hypotheses, objectives, variables, study design, and dataset.
Step 2: Data Cleaning and Preparation
Our team reviews the dataset for missing values, inconsistencies, coding issues, outliers, and other data-quality considerations.
Step 3: Statistical Method Selection
We identify appropriate statistical techniques based on the research design, data characteristics, assumptions, and analytical objectives.
Step 4: Statistical Testing and Regression Modelling
We conduct the selected statistical analysis and regression modelling while evaluating relevant assumptions and diagnostic measures.
Step 5: Results Interpretation
We interpret statistical outputs and explain how the findings relate to your hypotheses, research questions, and overall research objectives.
Step 6: Reporting and Final Delivery
We organize relevant results, tables, charts, and interpretations into a clear academic format according to the agreed project requirements.
Why Choose Research10X for Statistical Analysis?
At Research10X, we combine statistical knowledge with an understanding of academic research methodology.
Researchers choose our services because we provide:
- PhD-level research and statistical expertise
- Methodology-focused statistical analysis
- Comprehensive analysis from data preparation to interpretation
- Clear explanations of statistical findings
- Appropriate statistical testing based on research objectives
- Regression diagnostics and assumption checks
- Confidential and ethical research practices
- Academic and publication-oriented reporting
- Dedicated support for doctoral and postgraduate research
We believe that good statistical analysis should be accurate, methodologically appropriate, and understandable.
You can also explore our broader Research10X Services to find other research consulting and analytical services relevant to your project.
Who Can Benefit From Our Services?
Our Regression and Statistical Analysis Services are suitable for researchers working on quantitative and mixed-method research projects.
We work with:
- PhD scholars
- Master’s students
- MBA, MSc, and MA students
- Academic researchers
- University faculty
- Journal publication authors
- Industry professionals conducting research
Our statistical expertise can be applied across disciplines such as business administration, economics, psychology, sociology, education, public health, management, and other research fields.
Get Professional Regression and Statistical Analysis Support
Statistical analysis can significantly influence the credibility of your research findings. Choosing an inappropriate test, overlooking statistical assumptions, or misinterpreting model outputs can affect the conclusions drawn from your study.
At Research10X, we combine statistical expertise with research methodology to provide structured Regression and Statistical Analysis Services tailored to your research objectives and dataset.
Whether you are working on a PhD thesis, dissertation, Master’s research project, journal paper, or quantitative study, our team can review your requirements and recommend an appropriate statistical approach.
Share your research objectives, dataset, hypotheses, or statistical requirements with us today. Our research consultants will assess your project and guide you toward an appropriate analysis strategy.
Ready to Discuss Your Research?
Get in touch with Research10X today for a consultation on your regression or statistical analysis requirements and take the next step toward accurate, well-interpreted research findings.
Frequently Asked Questions About Regression and Statistical Analysis
1. What does your Regression and Statistical Analysis Service include?
At Research10X, our services can cover data preparation, statistical method selection, regression analysis, hypothesis testing, diagnostics, results interpretation, tables, visualisations, and academic reporting.
2. What types of regression analysis do you support?
Depending on the research design, we can work with linear regression, multiple regression, logistic regression, panel data regression, time series regression, and relevant regression diagnostics.
3. What is the difference between regression analysis and general statistical analysis?
Regression analysis focuses primarily on relationships between dependent and independent variables and can be used for prediction or hypothesis testing. General statistical analysis is broader and can include descriptive statistics, correlation, group comparisons, reliability testing, factor analysis, and other techniques.
4. Can you interpret regression results for Chapter 4?
Yes. We can provide research-focused interpretation of relevant statistical outputs and explain significant and non-significant findings in relation to your research questions and hypotheses.
5. How do you maintain confidentiality?
We treat research datasets and project information as confidential and follow appropriate practices for responsible data handling.
6. Which statistical software do you use?
Our statistical toolkit includes IBM SPSS, AMOS, SmartPLS, R/RStudio, Stata, EViews, and Python. The software selected depends on the analytical requirements of the research project.
7. What data do I need to provide before analysis?
Depending on the project, we may require your dataset, questionnaire or measurement instrument, research objectives, hypotheses, research questions, variable information, and relevant methodological details.
8. How do you check regression assumptions?
We review relevant assumptions and diagnostic considerations, which may include multicollinearity, heteroscedasticity, normality, outliers, independence, and model specification.