
Choosing the right dissertation data analysis software can affect how clearly you test your research questions, evaluate hypotheses, and present your findings. Two tools that often come up are SPSS and SmartPLS. While both are widely used for academic research, they are designed for different types of statistical analysis.
The question is not simply whether SPSS or SmartPLS is “better.” The better choice depends on your research design, variables, hypotheses, sample, and statistical techniques. In this guide, we compare SPSS vs SmartPLS so you can decide which software fits your dissertation analysis.
What Are SPSS and SmartPLS? A Clear Comparison
What is SPSS?
SPSS, originally known as Statistical Package for the Social Sciences, is a statistical analysis program commonly used for quantitative research. It is particularly useful when a dissertation requires descriptive statistics, correlation, regression, hypothesis testing, ANOVA, and other conventional statistical procedures.
Researchers can use SPSS to clean and organize datasets, examine relationships between variables, test assumptions, and generate statistical results. Its interface also makes many analyses accessible without requiring extensive programming knowledge.
For many master’s dissertations and PhD studies, SPSS is a practical starting point when the research involves observed variables and standard statistical tests.
What is SmartPLS?
SmartPLS is primarily designed for structural equation modeling (SEM), especially Partial Least Squares Structural Equation Modeling (PLS-SEM).
It is useful when a research model contains multiple constructs, indicators, direct relationships, mediation, moderation, or more complex paths between variables. Instead of focusing mainly on individual statistical tests, SmartPLS allows researchers to evaluate an entire conceptual model.
For example, a dissertation might examine whether service quality influences customer satisfaction and whether customer satisfaction subsequently affects customer loyalty. If these concepts are measured using multiple questionnaire items, SmartPLS can be particularly useful.
Key Difference Between SPSS and SmartPLS
The simplest way to understand the difference is this:
SPSS is generally better suited to traditional statistical analysis, while SmartPLS is designed specifically for structural equation modeling and PLS-SEM.
That does not mean the two tools compete directly in every dissertation. In many research projects, they can actually complement each other.
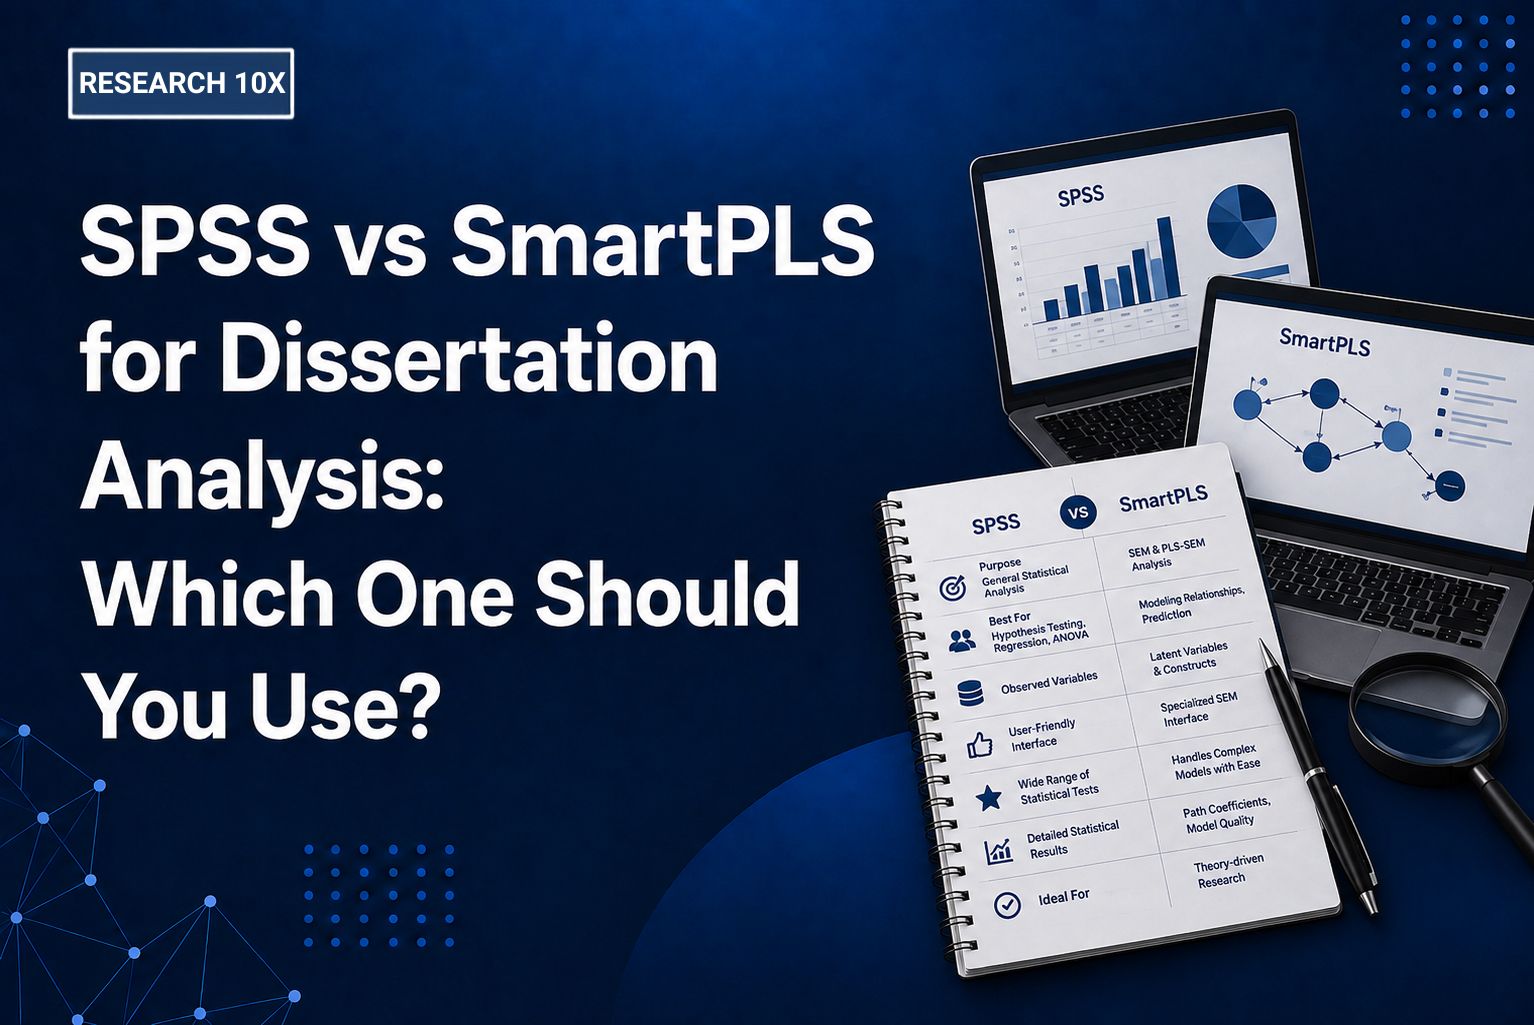
SPSS vs SmartPLS: Key Differences at a Glance
Feature | SPSS | SmartPLS |
Main purpose | Statistical analysis | Structural equation modeling |
Descriptive statistics | Yes | Limited compared with SPSS |
Correlation | Yes | Available within model analysis |
Regression | Yes | PLS path modeling |
ANOVA | Yes | Not its primary purpose |
PLS-SEM | No | Yes |
Latent constructs | Limited | Strong capability |
Measurement model | Limited | Yes |
Structural model | No | Yes |
Mediation | Yes, using appropriate procedures | Yes |
Moderation | Yes, using appropriate procedures | Yes |
Complex research models | Less suitable | Well suited |
Questionnaire-based construct modeling | Possible | Strong fit |
So, when comparing SPSS vs SmartPLS for dissertation work, start with the analysis method rather than the software’s popularity.
If your dissertation mainly requires descriptive statistics, correlation, regression, or ANOVA, SPSS may be enough. If your research framework contains latent constructs and multiple paths, SmartPLS may be the more appropriate option.
When Should You Use SPSS for Dissertation Analysis?
SPSS is usually a strong choice when your research questions require conventional statistical techniques. It can handle many of the analyses commonly expected in quantitative dissertations.
Descriptive Statistics
Descriptive statistics help you understand and summarize your dataset before moving into hypothesis testing.
With SPSS, you can calculate measures such as:
- Mean
- Median
- Standard deviation
- Frequency
- Percentage
- Minimum and maximum values
For example, if you collect questionnaire responses from 300 participants, SPSS can help you summarize demographic characteristics and describe how respondents answered individual survey questions.
Hypothesis Testing
SPSS can be used to test whether observed relationships or differences in your data are statistically meaningful.
Depending on your research design, you may use tests such as t-tests, chi-square tests, or other appropriate statistical procedures.
The important point is that the statistical test should be selected based on your research question and data, not simply because the test is available in SPSS.
Correlation Analysis
Correlation analysis is useful when you want to determine whether two variables are associated with each other.
For instance, a researcher could examine the relationship between employee satisfaction and employee performance. SPSS can calculate correlation coefficients and provide significance values that help interpret the relationship.
However, correlation does not automatically demonstrate causation. Your interpretation should remain consistent with your research design.
Regression Analysis
Regression is another common reason researchers choose SPSS.
You might use simple or multiple regression to examine whether one or more independent variables predict a dependent variable. For example, a dissertation could investigate whether perceived usefulness, ease of use, and trust predict users’ intention to adopt a technology.
When regression is the main analysis method, SPSS is often a straightforward choice.
ANOVA and Related Tests
ANOVA can help researchers compare the means of groups.
For example, you might want to determine whether customer satisfaction differs across three customer age groups or whether employee performance differs across several departments.
SPSS is well established for these types of traditional statistical comparisons.
For researchers who need assistance with these procedures, SPSS Data Analysis services can also be considered when planning or reviewing dissertation analysis.
When Should You Use SmartPLS for Dissertation Analysis?
SmartPLS becomes more relevant when your dissertation goes beyond individual statistical tests and involves a conceptual model made up of multiple constructs and relationships.
Structural Equation Modeling
Structural equation modeling allows researchers to examine relationships among multiple variables within a broader theoretical model.
Instead of testing one relationship at a time, SEM can help evaluate a network of relationships. This makes it useful for dissertations based on established theories and conceptual frameworks.
PLS-SEM
PLS-SEM is one of the main reasons researchers choose SmartPLS.
It is particularly useful when your research focuses on prediction, contains several constructs, or involves a relatively complex model. Researchers can evaluate both the measurement model and structural model as part of the analysis.
However, PLS-SEM should not be selected simply because it appears easier. The method needs to match the research objectives, theoretical framework, measurement approach, and study design.
Latent Variables and Constructs
A major difference between SPSS and SmartPLS is how they handle constructs measured through multiple indicators.
Suppose “customer satisfaction” is not measured using one question but through several questionnaire items. These items can represent an underlying construct.
SmartPLS allows researchers to model these relationships explicitly and assess how indicators represent their respective constructs.
Mediation and Moderation Analysis
SmartPLS can also be useful when your dissertation includes mediation or moderation.
For example, you may hypothesize that:
Service Quality → Customer Satisfaction → Customer Loyalty
Here, customer satisfaction acts as a mediator.
Similarly, you might propose that the relationship between service quality and customer loyalty changes depending on another variable, such as customer involvement. This introduces a moderation effect.
SmartPLS can help model these relationships within a broader SEM framework.
Researchers looking specifically for SmartPLS SEM Analysis can use this type of analysis when their dissertation methodology calls for PLS-SEM.
SPSS vs SmartPLS for Different Types of Research
The right choice becomes easier when you connect the software to your research design.
Dissertation research situation | More suitable option |
Describing participant demographics | SPSS |
Frequency and percentage analysis | SPSS |
Testing correlations | SPSS |
Multiple regression | SPSS |
Comparing groups using ANOVA | SPSS |
Testing a basic statistical relationship | SPSS |
Testing a conceptual SEM model | SmartPLS |
PLS-SEM analysis | SmartPLS |
Multiple latent constructs | SmartPLS |
Measurement and structural models | SmartPLS |
Complex path relationships | SmartPLS |
Mediation within an SEM model | SmartPLS |
Moderation within an SEM model | SmartPLS |
There is some overlap. For example, both platforms can support forms of mediation and moderation analysis. The difference is how those analyses fit into the overall research framework.
If your dissertation is based around a theoretical model with several constructs and paths, SmartPLS deserves serious consideration. If your study is centered on conventional statistical testing, SPSS may be more appropriate.
Can You Use SPSS and SmartPLS Together for Dissertation Analysis?
Yes. Using both SPSS and SmartPLS in the same dissertation is possible and, in some research designs, practical.
The two programs can perform different parts of the analysis rather than forcing you to choose only one.
Using SPSS for Preliminary Analysis
SPSS can be used to prepare and examine your dataset before conducting SEM.
Depending on your methodology, this may include checking:
- Missing data
- Descriptive statistics
- Participant characteristics
- Data distributions
- Outliers
- Reliability-related measures
- Basic relationships between variables
The exact preliminary checks should follow your research methodology and the assumptions relevant to your chosen analysis.
Using SmartPLS for SEM
After preparing the dataset, researchers can import the required data into SmartPLS and construct their PLS-SEM model.
The analysis may then involve evaluating the measurement model and structural model, followed by testing the hypothesized relationships.
This workflow can make sense when the dissertation needs both descriptive or preliminary statistical analysis and a full PLS-SEM model.
Example Dissertation Workflow
Consider a dissertation investigating whether digital service quality affects customer loyalty through customer satisfaction.
A possible workflow could be:
Step 1: Collect questionnaire responses.
Step 2: Clean and organize the dataset.
Step 3: Use SPSS for descriptive and preliminary analysis.
Step 4: Define constructs and indicators for the conceptual model.
Step 5: Import the dataset into SmartPLS.
Step 6: Build the PLS-SEM model.
Step 7: Evaluate the measurement model.
Step 8: Evaluate the structural model and test hypotheses.
Step 9: Interpret the results in relation to the research questions and theoretical framework.
The exact workflow will depend on your methodology, supervisor requirements, and research design.
How to Choose Between SPSS and SmartPLS for Your Dissertation
There is no universal winner in the SPSS vs SmartPLS comparison. The choice should come from your research methodology.
Choose Based on Your Research Questions
Start with the question your dissertation is trying to answer.
If you are asking whether variables are correlated, whether groups differ, or whether one variable predicts another, traditional statistical analysis may be sufficient.
If you are testing a theoretical model involving several constructs and interconnected relationships, SEM may be more suitable.
Choose Based on Your Hypotheses
Look at the structure of your hypotheses.
A hypothesis such as:
H1: Employee motivation significantly influences job performance.
may be tested using regression or another suitable statistical method.
A model containing several hypotheses such as:
H1: Service quality influences satisfaction.
H2: Satisfaction influences loyalty.
H3: Service quality influences loyalty.
H4: Satisfaction mediates the relationship between service quality and loyalty.
may be better suited to a structural model, particularly when the variables are latent constructs measured through multiple indicators.
Choose Based on Your Data and Variables
Consider how your variables have been measured.
If your study uses straightforward observed variables, SPSS may provide everything you need.
If your questionnaire measures theoretical constructs through multiple indicators, SmartPLS can provide a framework for analyzing the measurement and structural relationships.
Your sample size and data characteristics should also be considered according to the statistical method you intend to use.
Choose Based on the Statistical Technique
This is often the easiest decision point.
Ask yourself:
- What statistical technique does my methodology require?
If the answer is regression, correlation, ANOVA, t-test, or similar traditional procedures, SPSS may be appropriate.
If the answer is PLS-SEM, path modeling involving latent constructs, or a measurement and structural model, SmartPLS is likely the better fit.
Common Mistakes When Choosing Dissertation Data Analysis Software
Choosing software before deciding on the analysis method can create unnecessary problems.
One common mistake is selecting SmartPLS simply because the dissertation has many hypotheses. The number of hypotheses alone does not determine whether PLS-SEM is appropriate.
Another mistake is using SPSS for every dissertation because it is familiar. A complex theoretical model involving latent constructs may require a different analytical approach.
Researchers also sometimes confuse correlation, regression, and SEM. These methods can answer related but different questions, so the choice should be based on the research framework rather than the software interface.
Finally, avoid choosing an analysis method because it produces a preferred result. Your statistical approach should be determined by your research questions, hypotheses, measurement model, methodology, and academic requirements.
If you are unsure which approach fits your study, discussing the research model with a qualified research expert can help you clarify the appropriate analysis before running the tests.
SPSS vs SmartPLS: Quick Checklist Before You Choose
Before selecting your dissertation analysis software, ask:
- Do I mainly need descriptive statistics?
- Am I testing correlations or regression?
- Do I need ANOVA or group comparisons?
- Does my research contain latent variables?
- Are my constructs measured using multiple indicators?
- Does my conceptual framework require SEM?
- Does my methodology specifically require PLS-SEM?
- Do I need mediation or moderation within an SEM model?
- Has my supervisor recommended a particular statistical technique?
- Can I clearly justify my software and analysis method in the methodology chapter?
If you can answer these questions first, the SPSS vs SmartPLS decision becomes much less confusing.
SPSS vs SmartPLS: Final Recommendation for Dissertation Researchers
So, which should you use?
- Use SPSS when your dissertation primarily requires traditional statistical analysis such as descriptive statistics, correlation, regression, hypothesis testing, or ANOVA.
- Use SmartPLS when your dissertation requires PLS-SEM, latent constructs, measurement models, structural models, or complex relationships involving mediation and moderation.
And if your research requires both preliminary statistical analysis and SEM, you may be able to use SPSS and SmartPLS together.
The most important point is that the software should follow the methodology, not the other way around. Before starting your analysis, make sure the statistical technique matches your research questions, hypotheses, variables, conceptual framework, and dissertation requirements.
Research10X can be useful when you need structured support in understanding and implementing dissertation data analysis while keeping the analysis aligned with your research methodology.
Frequently Asked Questions About SPSS vs SmartPLS
Q1. Is SPSS better than SmartPLS for dissertation analysis?
Neither is universally better. SPSS is generally more suitable for traditional statistical analysis such as regression, correlation, ANOVA, and descriptive statistics. SmartPLS is better suited to PLS-SEM, latent constructs, and structural models. Your research methodology should determine the choice.
Q2. Can SmartPLS replace SPSS for dissertation analysis?
SmartPLS can handle some analyses that researchers may otherwise perform in SPSS, but it is not a direct replacement for every SPSS function. If your dissertation requires extensive traditional statistical testing, SPSS may still be useful alongside SmartPLS.
Q3. Which software is better for SEM in a dissertation?
For PLS-SEM, SmartPLS is specifically designed for structural equation modeling and is often the more suitable choice. However, the appropriate SEM approach depends on your research objectives, theoretical framework, constructs, data, and methodology rather than software preference alone.
Q4. Can I use both SPSS and SmartPLS in my dissertation?
Yes. Researchers can use SPSS for data preparation, descriptive statistics, and preliminary analysis, then use SmartPLS for PLS-SEM. If both are used, clearly explain the purpose of each software and analysis technique in your methodology chapter.
Q5. How do I decide between SPSS vs SmartPLS for my dissertation?
Start with your research questions and hypotheses. If you need conventional statistical tests, SPSS may be sufficient. If you need latent constructs, PLS-SEM, or a structural model, SmartPLS may be more appropriate. Your methodology and supervisor’s requirements should guide the final decision.