
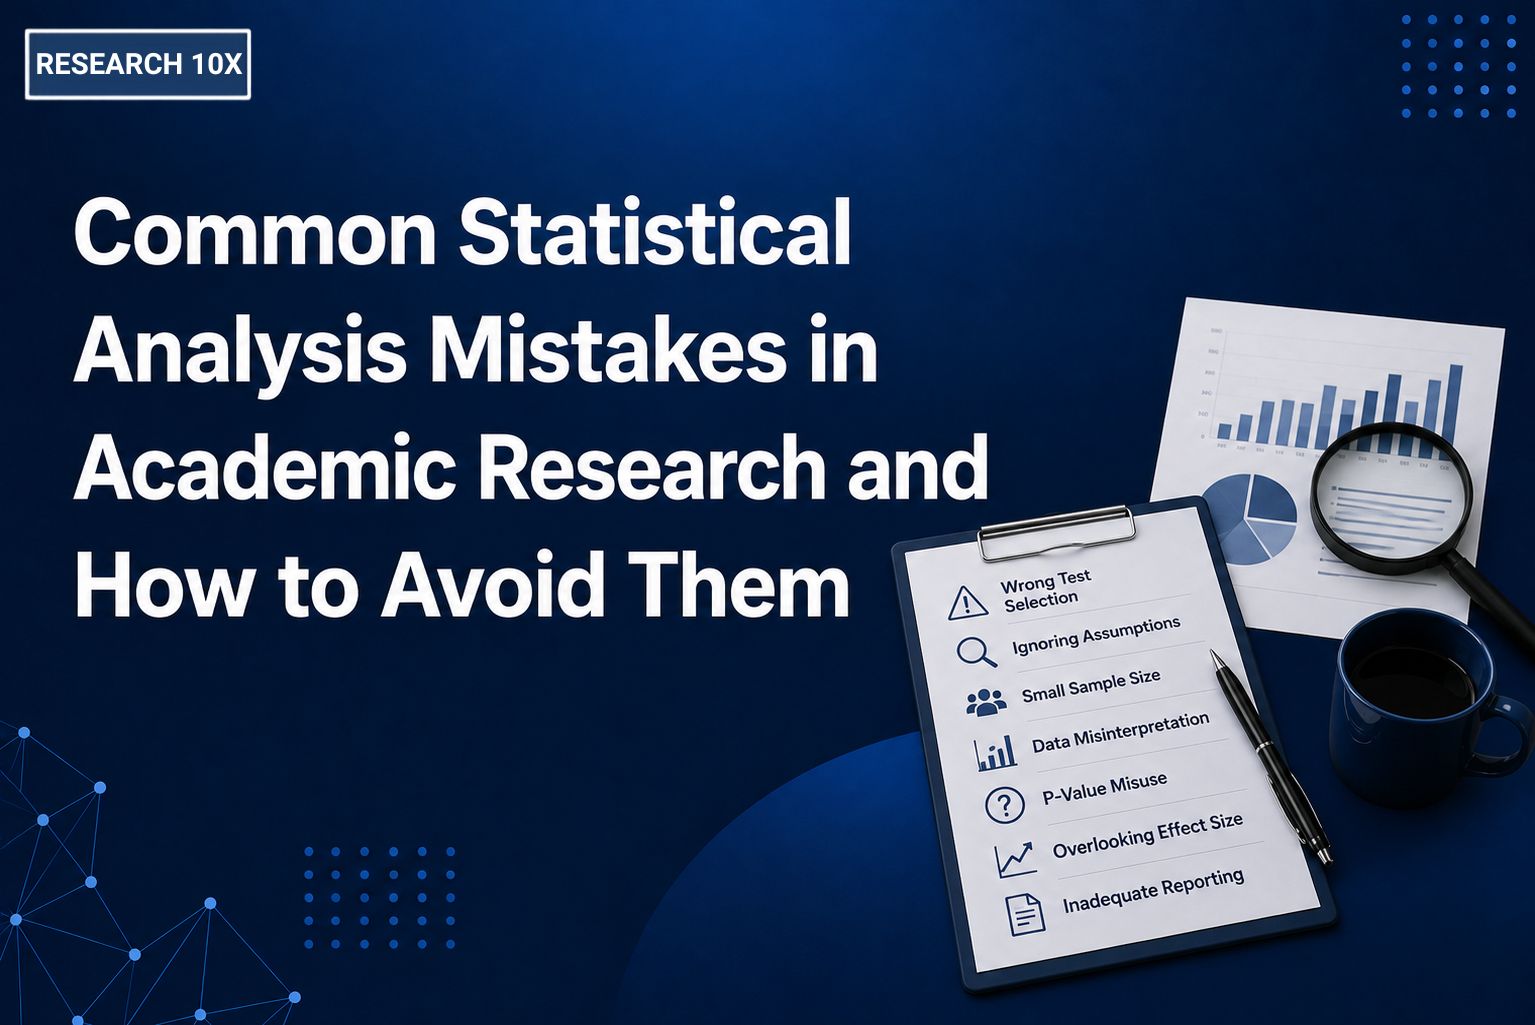
Statistical analysis can strengthen an academic study, but even a well-designed research project can lose credibility when the data is analyzed incorrectly. Statistical analysis mistakes can affect everything from hypothesis testing and interpretation to the conclusions presented in a dissertation or research paper.
The problem is not always a complicated calculation. Sometimes the mistake is as simple as choosing the wrong test, using an unsuitable sample, misunderstanding a p-value, or reporting statistically significant findings without explaining what they actually mean. Researchers working with a research expert can also use statistical guidance to check whether their analytical approach matches their research questions and study design.
For researchers, PhD scholars, Master’s students, and academics, knowing the most common statistical mistakes is just as important as knowing how to run a statistical test. This guide explains the errors researchers frequently make, how to select appropriate tests, and what you can do to make your dissertation statistical analysis more reliable.
Why Statistical Analysis Matters in Academic Research
Statistical analysis helps researchers turn collected data into evidence that can answer research questions. Depending on the study, it may be used to describe a sample, compare groups, identify relationships, predict outcomes, or test theoretical models.
Good analysis does more than produce numbers. It helps researchers determine whether patterns in the data are meaningful and whether the findings support their hypotheses.
Poor analysis can have the opposite effect. A technically incorrect test or misleading interpretation can produce conclusions that the original data does not support. That is why academic research statistics should always be connected to the research objectives, variables, study design, and assumptions behind the selected method.
15 Common Statistical Analysis Mistakes Researchers Make
1. Choosing the Wrong Statistical Test
One of the most common statistical errors in research is selecting a test simply because it is familiar.
For example, a researcher may use a t-test when the research question requires ANOVA, or apply Pearson correlation when the variables do not meet the conditions required for that analysis.
The correct test depends on factors such as:
- Research question
- Type of variables
- Number of groups
- Measurement scale
- Distribution of the data
- Study design
- Statistical assumptions
Start with the research question rather than the software. Once you know what you need to determine, selecting an appropriate test becomes much easier.
2. Using an Inadequate Sample Size
A statistical test cannot compensate for a poorly sized sample.
A small sample may lack sufficient statistical power to detect a meaningful effect. On the other hand, a very large sample can sometimes produce statistically significant results for differences that have little practical importance.
Before collecting data, consider the expected effect size, significance level, desired statistical power, study design, and number of predictors or groups involved.
Sample size should ideally be justified during the research design stage rather than after the results have been collected.
3. Ignoring Assumptions of Statistical Tests
Many statistical procedures have assumptions that need to be checked before the analysis.
Depending on the method, these may include:
- Normality
- Independence
- Homogeneity of variance
- Linearity
- Absence of extreme outliers
- Absence of problematic multicollinearity
Ignoring these conditions can make statistical results unreliable.
For instance, running a parametric test without considering whether its assumptions are reasonably satisfied can affect the validity of the findings. Researchers should check relevant assumptions and explain important decisions in the methodology or analysis section.
4. Misinterpreting P-Values
A p-value is frequently misunderstood.
A p-value does not tell you the probability that your research hypothesis is true. It also does not tell you how large or important an effect is.
Instead, it helps assess how compatible the observed data is with a specified null hypothesis under the assumptions of the statistical model.
For example, a result with p < 0.05 is commonly described as statistically significant under a 5% significance threshold. However, this does not automatically mean the finding is important, useful, or practically meaningful.
5. Confusing Correlation With Causation
Correlation shows that variables are associated. It does not automatically establish that one variable causes another.
Suppose a study finds a relationship between study time and academic performance. The result does not, by itself, prove that increasing study time caused the change in performance.
Other factors may influence both variables.
Researchers should therefore use causal language carefully and consider the research design before making cause-and-effect claims.
6. Misinterpreting Statistical Significance
Statistical significance and practical significance are not the same thing.
With a sufficiently large sample, a very small difference may become statistically significant. That does not necessarily mean the difference matters in real-world terms.
Researchers should consider the size of the effect, confidence intervals, context, and practical implications alongside the p-value.
This gives readers a more complete understanding of what the findings actually mean.
7. Ignoring Effect Size
Another common data analysis mistake is reporting only whether a result is significant.
Effect size helps communicate the magnitude of an observed difference or relationship. Depending on the analysis, researchers may report measures such as Cohen’s d, correlation coefficients, odds ratios, R², or other appropriate effect-size measures.
Including effect sizes can make research findings much more informative because readers can understand not only whether an effect exists but also how substantial it may be.
8. Reporting Incomplete Results
A dissertation or research paper should provide enough statistical information for readers to understand and evaluate the analysis.
Reporting only statements such as “the result was significant” is usually insufficient.
Depending on the test, results may need to include:
- Test statistic
- Degrees of freedom
- p-value
- Effect size
- Confidence interval
- Descriptive statistics
- Relevant model information
Follow the reporting requirements of your discipline, target journal, university, or style guide.
9. Misusing Regression Analysis
Regression is widely used to examine relationships between variables and make predictions, but it is easy to misuse.
Researchers sometimes include variables without a clear theoretical justification, overlook assumptions, interpret coefficients incorrectly, or claim causation from observational regression results.
Before running a regression model, clearly define the dependent variable, predictors, research rationale, coding of variables, and assumptions.
For more complex studies, researchers may benefit from specialized Regression and Statistical Analysis support to review model selection, assumptions, interpretation, and reporting.
10. Overlooking Multicollinearity
Multicollinearity occurs when two or more predictor variables in a regression model are strongly related to each other.
This can make individual coefficient estimates unstable and make it difficult to determine the unique contribution of each predictor.
Researchers can examine indicators such as correlation patterns and variance inflation factor (VIF), depending on the model and analytical approach.
If multicollinearity is substantial, researchers should investigate whether variables need to be removed, combined, transformed, or handled through a different modeling strategy.
11. Ignoring Missing Data
Missing values are common in surveys, experiments, interviews, and other forms of academic research.
Simply deleting cases without understanding why data is missing can introduce bias or reduce the usable sample unnecessarily.
Researchers should examine the amount and pattern of missing data and select an appropriate approach based on the study design and missingness mechanism.
The method used to handle missing data should also be documented clearly.
12. Using Inappropriate Variables
Sometimes the problem begins before statistical testing.
Researchers may use variables that do not properly represent the concepts being studied, apply incorrect measurement levels, or create categories that do not make methodological sense.
For example, treating an ordinal variable as continuous without justification can affect the suitability of certain analyses.
Before analysis, review how each variable was measured, coded, and defined. The statistical method should fit the way the data actually exists, not the way the researcher wishes it existed.
13. Running Too Many Tests Without Proper Consideration
Running many statistical tests increases the likelihood of finding a statistically significant result by chance.
This is particularly important when researchers conduct numerous comparisons but do not account for multiple testing.
Researchers should distinguish between analyses that were planned in advance and exploratory analyses conducted after reviewing the data.
When multiple comparisons are necessary, appropriate statistical procedures or corrections may be required depending on the research context.
14. Manipulating or Selectively Reporting Results
Researchers should not remove inconvenient results, change analytical decisions simply to obtain significance, or report only analyses that support their preferred conclusion.
Selective reporting can seriously undermine research credibility.
A transparent approach explains relevant analytical decisions, reports findings honestly, and distinguishes exploratory observations from confirmatory hypotheses.
If results do not support the original hypothesis, that is still a legitimate research finding. The role of statistical analysis is to evaluate evidence, not manufacture a desired outcome.
15. Presenting Statistics Without Interpretation
A table full of coefficients, p-values, means, and standard deviations does not automatically explain what the findings mean.
Researchers need to connect statistical results to the research questions and hypotheses.
Instead of simply stating that a coefficient was significant, explain its direction, magnitude, uncertainty, and relevance to the research problem.
Good statistical reporting answers the reader’s most important question: So, what does this result mean for the study?
How to Choose the Right Statistical Test for Academic Research
Choosing a statistical test becomes easier when you begin with the research question and the type of data rather than starting with SPSS, SmartPLS, or another software package.
Here is a practical overview of commonly used methods.
Descriptive Statistics
Use descriptive statistics when the goal is to summarize your dataset.
Common measures include:
- Mean
- Median
- Mode
- Standard deviation
- Frequency
- Percentage
- Minimum and maximum values
Descriptive statistics are often the first step before conducting inferential analysis.
Correlation
Correlation is useful when you want to examine the strength and direction of an association between variables.
Pearson correlation is commonly used for suitable continuous variables, while Spearman correlation can be useful for ranked or non-normally distributed data in appropriate situations.
Remember that correlation does not establish causation.
T-Test
A t-test is commonly used to compare means between two groups or conditions.
The appropriate form depends on the research design. For example, an independent-samples t-test compares two independent groups, while a paired-samples t-test compares related measurements.
ANOVA
ANOVA is generally used when comparing means across three or more groups.
If the overall ANOVA is statistically significant, researchers may need appropriate post-hoc comparisons to identify which groups differ.
The assumptions of the analysis should also be considered before interpreting the results.
Regression
Regression analysis is used to examine relationships between a dependent variable and one or more predictors.
Depending on the research question, researchers may use simple or multiple linear regression, logistic regression, or other forms of regression modeling.
The model should be driven by the research question and theoretical framework, not simply by which variables produce significant coefficients.
Chi-Square
The chi-square test is commonly used with categorical variables to examine whether there is an association between them or whether observed frequencies differ from expected frequencies.
Researchers should consider the structure and frequency of the data before applying the test.
SEM and PLS-SEM
Structural equation modeling (SEM) is useful for examining complex relationships among observed and latent variables.
PLS-SEM is one approach within the broader SEM family and is often used in studies involving predictive objectives, latent constructs, and complex models.
Researchers should understand the assumptions, measurement model, structural model, and reporting requirements before selecting SEM or PLS-SEM.
How to Interpret Statistical Results Correctly
Correct statistical interpretation requires more than checking whether p < 0.05.
Start by returning to the research question. Ask what relationship, difference, prediction, or effect the analysis was designed to examine.
Then review the direction and magnitude of the result. A statistically significant positive coefficient, for example, indicates an association in a positive direction, but its practical meaning depends on the scale and context of the variables.
Confidence intervals can also provide useful information about uncertainty around an estimate. Where appropriate, report effect sizes alongside significance tests.
Finally, avoid claims that go beyond the study design. An observational study may identify associations without proving causality, while a poorly controlled experiment may have limitations that affect causal interpretation.
How SPSS and SmartPLS Can Help Reduce Statistical Errors
Statistical software can make analysis faster and more organized, but software does not automatically make an analysis correct.
SPSS can support descriptive statistics, hypothesis testing, correlation, regression, ANOVA, and many other commonly used procedures. Researchers can use SPSS Data Analysis to organize datasets, run appropriate analyses, and interpret outputs more systematically.
SmartPLS can be useful for researchers working with PLS-SEM models and latent constructs. It can help assess measurement and structural models while providing outputs that researchers can use for interpretation and reporting.
The important point is that software should support methodological decisions, not replace them. Selecting a test still requires an understanding of the research question, variables, assumptions, and study design.
Statistical Analysis Checklist for Dissertations and Research Papers
Before finalizing your dissertation statistical analysis, run through these questions:
- Does each statistical test directly address a research question or hypothesis?
- Are the variables measured and coded correctly?
- Is the sample size adequate for the planned analysis?
- Have the relevant assumptions been checked?
- Have missing values and outliers been reviewed?
- Have potential multicollinearity issues been examined?
- Are p-values interpreted correctly?
- Are effect sizes reported where appropriate?
- Are confidence intervals included where relevant?
- Are statistical and practical significance clearly distinguished?
- Have all relevant results been reported honestly?
- Does the interpretation match the research design?
- Are causal claims supported by the study design?
- Are tables and figures clearly labeled?
- Can another researcher understand how the analysis was conducted?
If several answers are “no,” review the analysis before submitting the dissertation or manuscript.
When Should You Get Statistical Analysis Support?
You do not necessarily need external support for every statistical task. However, statistical guidance can be useful when the analysis becomes difficult to justify or interpret.
Consider getting support if you are unsure which test matches your research question, struggling with assumptions, dealing with missing data, building a regression model, interpreting SPSS output, developing a SEM or PLS-SEM model, or explaining statistical findings in your dissertation.
Support can also be valuable before analysis begins. Reviewing the statistical plan early can prevent problems that become much harder to fix after data collection.
Research10X can assist researchers with statistical analysis decisions, interpretation, and reporting while keeping the analysis aligned with the objectives of the academic study.
Conclusion: How to Avoid Statistical Analysis Mistakes
Most statistical analysis mistakes are avoidable when researchers slow down and connect every analytical decision to the research question, study design, variables, and assumptions.
Do not choose a test simply because it is available in SPSS or another software package. Check whether the sample and data are suitable, interpret p-values in context, report effect sizes where appropriate, and avoid conclusions that go beyond the evidence.
For dissertations and research papers, good statistical analysis is not about producing the most complicated output. It is about using the right method, reporting the results transparently, and explaining what those results mean.
Frequently Asked Questions on Statistical Analysis Mistakes
Q1. What are the most common statistical mistakes in research?
Common statistical mistakes include choosing the wrong test, using an inadequate sample size, ignoring test assumptions, misinterpreting p-values, confusing correlation with causation, ignoring effect size, mishandling missing data, and selectively reporting significant findings.
Q2. How do I know which statistical test to use?
Choose a statistical test based on your research question, variable types, number of groups, study design, measurement scale, and assumptions. Start by identifying what you need to compare, predict, or examine rather than selecting a test based only on the software available.
Q3. What statistical errors can lead to dissertation rejection?
Serious statistical errors can include inappropriate test selection, unsupported conclusions, incorrect interpretation, inadequate sample justification, failure to address assumptions, inconsistent reporting, and analyses that do not answer the stated research questions or hypotheses.
Q4. How can I avoid mistakes in dissertation data analysis?
Create a statistical analysis plan before running tests, check your data and assumptions, use methods that match your research questions, report relevant statistics transparently, and review your interpretation carefully. Getting statistical analysis support before final submission can also help identify methodological problems.
Q5. Are statistical significance and practical significance the same?
No. Statistical significance indicates whether the observed evidence is inconsistent with a specified null hypothesis under the model assumptions. Practical significance considers whether the size of the effect is meaningful in the real-world or academic context.